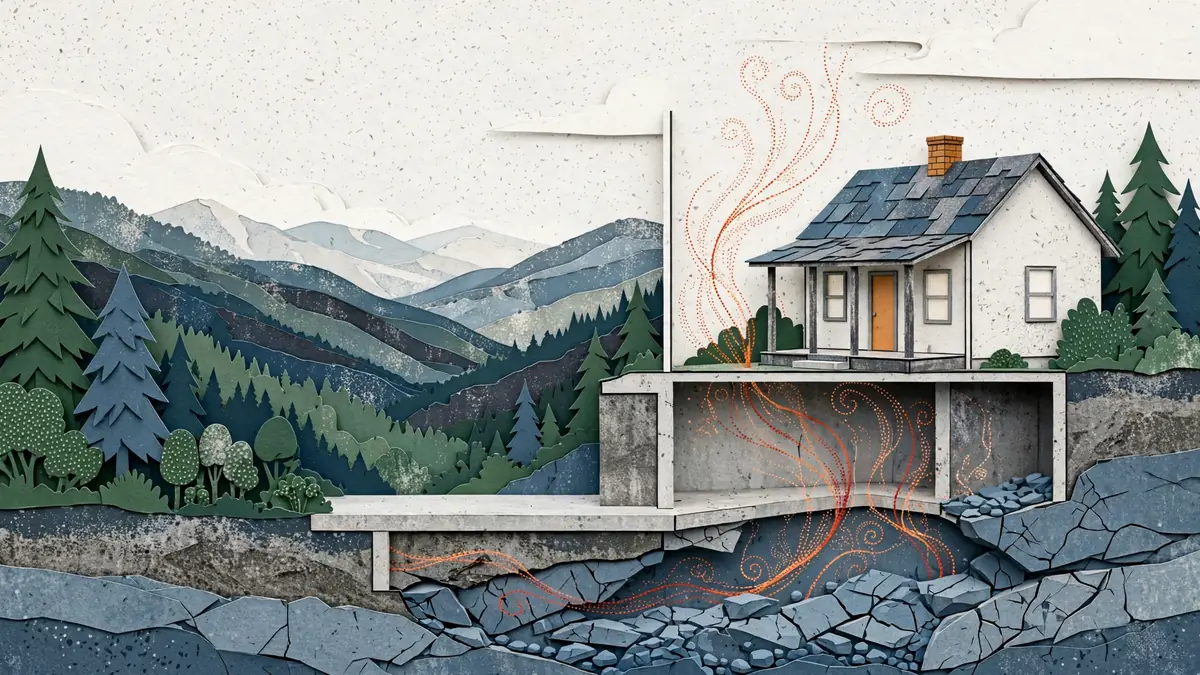
EPA classifies Scott County as Zone 3: predicted average indoor radon below 2 pCi/L. EPA also warns that elevated homes occur in every zone and recommends that every home be tested. [1]
<2
pCi/L predicted average
This is a county-scale model, not a measurement of your basement, crawlspace, slab, well-sealed addition, or finished lower level.
Scott County dashboard values: withheld
Repeated attempts on the Tennessee Radon Testing dashboard landed on neighboring counties. Because the tooltip's “County” label never confirmed Scott County, no average, median, or maximum is published here. The dashboard's pre/post charts are health-region aggregates, not county counts. Open the state dashboard. [8]
Verified nearby readings demonstrate why the zone label should not be overread. These figures are context, not Scott County substitutes, and come from the 2022–2023 dashboard with the county name confirmed in the tooltip. [8]
Campbell
3.7 avg
0.8 median · 7.2 max pCi/L
Matched across two loads.
Fentress
2.3 avg
Median and maximum rendered blank; average only.
Overton
7.4 avg
0.7 median · 32.1 max pCi/L
One verified load.